Quantification that speaks the pathologist's language.
We present v1 of the BCMG IHC Scorer, an image-analysis pipeline for brightfield 3,3′-diaminobenzidine (DAB) immunohistochemistry that anchors its quantitative colormap on the standard semi-quantitative 0+, 1+, 2+, 3+ scoring scale used at the microscope. Color deconvolution (Ruifrok H-DAB) isolates the DAB channel; a piecewise-linear normalization maps optical density into a four-stop colormap whose category boundaries correspond to pathologist-meaningful thresholds. An optional multi-scale ridge filter emphasizes linear membranous structures without overriding bulk cytoplasmic signal. A toggleable anchor-source architecture allows per-slide negative-control calibration where available, while preserving literature-default anchors as a non-destructive fallback. Validation on a five-case TROP2 NSCLC cohort recovers expected clinical ordering and surfaces clinically relevant intra-case heterogeneity that single-field sampling would otherwise miss.
(i) A pathologist-anchored colormap that decouples perception from DAB's nonlinear response. (ii) A revertible calibration architecture in which every automated derivation is a proposal, not an override. (iii) A toggleable membrane-emphasis layer that respects the inherent ambiguity of membrane/cytoplasmic distinctions in grey-area cases. (iv) Auditable per-run QC provenance.
Why anchored.
Standard quantitative IHC heatmaps display DAB optical density (OD) using colormaps normalized to the per-slide minimum and maximum. This makes every slide look visually similar, but the cost is that color no longer carries cross-slide meaning: a red pixel on one slide may correspond to a pathologist 2+ region, and a red pixel on another to a 3+ region. The semantics drift.
The semi-quantitative 0+ / 1+ / 2+ / 3+ scale, despite its limitations, remains the most clinically meaningful reference frame for IHC scoring, and it is the frame in which therapeutic decisions are made for biomarkers such as HER2, PD-L1, and the emerging TROP2-directed antibody–drug conjugate ecosystem. Anchoring a quantitative colormap on these categorical endpoints — rather than on the slide's intensity extremes — produces a heatmap that is directly readable in the vocabulary of the microscope. A pixel rendered yellow is, definitionally, between a 1+ and a 2+. A pixel rendered red is at or above the 3+ anchor.
Color stops become semantic categories, not arbitrary stretches of the intensity histogram.
A second motivation is DAB's well-documented saturation behavior. As a precipitate rather than a stoichiometric stain, DAB optical density becomes nonlinear above approximately OD 0.8–1.0 and effectively plateaus near 1.5. Per-slide min–max normalization compresses the upper end of this curve into a single colormap stop and discards information about how saturated the slide really is. A fixed-anchor scheme makes saturation visible: when most of a tumor sits beyond the 3+ anchor, the anchored render is uniformly red because the case is, in fact, uniformly strong.
Pipeline.
The scorer accepts brightfield RGB whole-slide image (WSI) tiles or registered crops, performs H-DAB color deconvolution, and renders both a continuous-jet and an anchored four-stop visualization in parallel. An optional ridge-filter pass emphasizes membranous structures. A tissue mask suppresses background. Every run emits an auditable QC record capturing the anchor source, anchor values, and rendering parameters.
Color deconvolution.
RGB is converted to optical density via the Beer–Lambert relation
OD = −log10((I+1)/256), and decomposed into hematoxylin,
DAB, and residual components by inverting the orthonormalized Ruifrok
stain matrix. The DAB channel concentration map serves as input to all
downstream rendering. v1 uses the published Ruifrok stain vectors as
fixed inputs; per-slide stain-vector estimation (Macenko or Vahadane)
is deferred to v2.
Anchored colormap.
DAB OD is mapped into a unit interval via piecewise-linear interpolation, with breakpoints at each scoring anchor. Each category receives equal colormap real estate (0.33 of the [0,1] range, except the top band which receives 0.34 to absorb rounding). This decouples the colormap from DAB's nonlinear response: even when the slide's OD distribution is heavily compressed near saturation, the four scoring categories remain visually distinguishable.
def score_normalize(dab_od, anchors):
    a0, a1, a2, a3 = anchors['0+'], anchors['1+'], anchors['2+'], anchors['3+']
    out = np.zeros_like(dab_od, dtype=np.float32)
    m = (dab_od > a0) & (dab_od <= a1); out[m] = (dab_od[m]-a0)/(a1-a0) * 0.33
    m = (dab_od > a1) & (dab_od <= a2); out[m] = 0.33 + (dab_od[m]-a1)/(a2-a1) * 0.33
    m = (dab_od > a2) & (dab_od <= a3); out[m] = 0.66 + (dab_od[m]-a2)/(a3-a2) * 0.34
    out[dab_od > a3] = 1.00
return out| Category | DAB OD | Color stop | Interpretation |
|---|---|---|---|
| 0+ | 0.15 | #2B4CFF | Background / no specific stain |
| 1+ | 0.35 | #00B8E6 | Weak |
| 2+ | 0.70 | #FFC000 | Moderate |
| 3+ | 1.10 | #D4051A | Strong, below DAB saturation (~1.5) |
Membrane emphasis.
A multi-scale Sato tubeness filter is applied to the DAB OD channel
at sigmas of 1, 2, and 3 pixels (≈ 0.5–1.5 µm at 20×). The filter's
response is normalized to [0, 1] by 1st–99th percentile clipping and
combined with the raw OD in one of three modes:
off (raw OD, default),
weight (OD modulated by ridge response, preserving bulk
signal), or only (OD multiplied by ridge response, isolating
linear membranous structures).
The toggle is intentional. Membrane versus cytoplasmic distinctions are clinically meaningful for some markers (HER2, certain TROP2 scoring schemes) and ambiguous or artificial in grey-area cases. We expose the choice to the pathologist rather than baking it into the scoring logic.
Toggleable anchor source.
Anchor calibration is the most consequential decision the pipeline
makes. v1 maintains two anchor slots per slide: the
literature defaults (always present, never overwritten) and
an optional override set, which may be populated from
paired negative-control derivation or manually. A single
active_source flag selects which set is used for
rendering. Switching back to defaults is a single call; the override
is preserved on revert so it can be compared without recomputation.
Negative-control slides are not always available, and not always reliable when they are (endogenous peroxidase leakage, sectioning artifacts, tissue scarcity). The architecture treats this as the normal case. Derived anchors must pass sanity checks before they can be activated; failure raises and the caller stays on defaults. Every run emits a QC record capturing the active source, anchor values, and metadata for provenance.
@dataclass
class ScorerConfig:
    anchors_literature: AnchorSet   # always present
    anchors_override:   Optional[AnchorSet]   # opt-in
    active_source: str = 'literature'

    def use_literature(self):  ...   # one-call revert, override preserved
    def use_override(self, anchors=None):  ...
def qc_record(self) -> dict: ... # full audit trail per runFive-case TROP2 cohort.
We validated v1 on five 20× crops drawn from an internal TROP2 accuracy cohort of non–small cell lung carcinoma (NSCLC), selected to span the full clinical range from frankly negative to DAB-saturated. The same literature-default anchors were applied uniformly; no per-slide tuning was performed. Membrane-OFF results are reported as the primary readout.
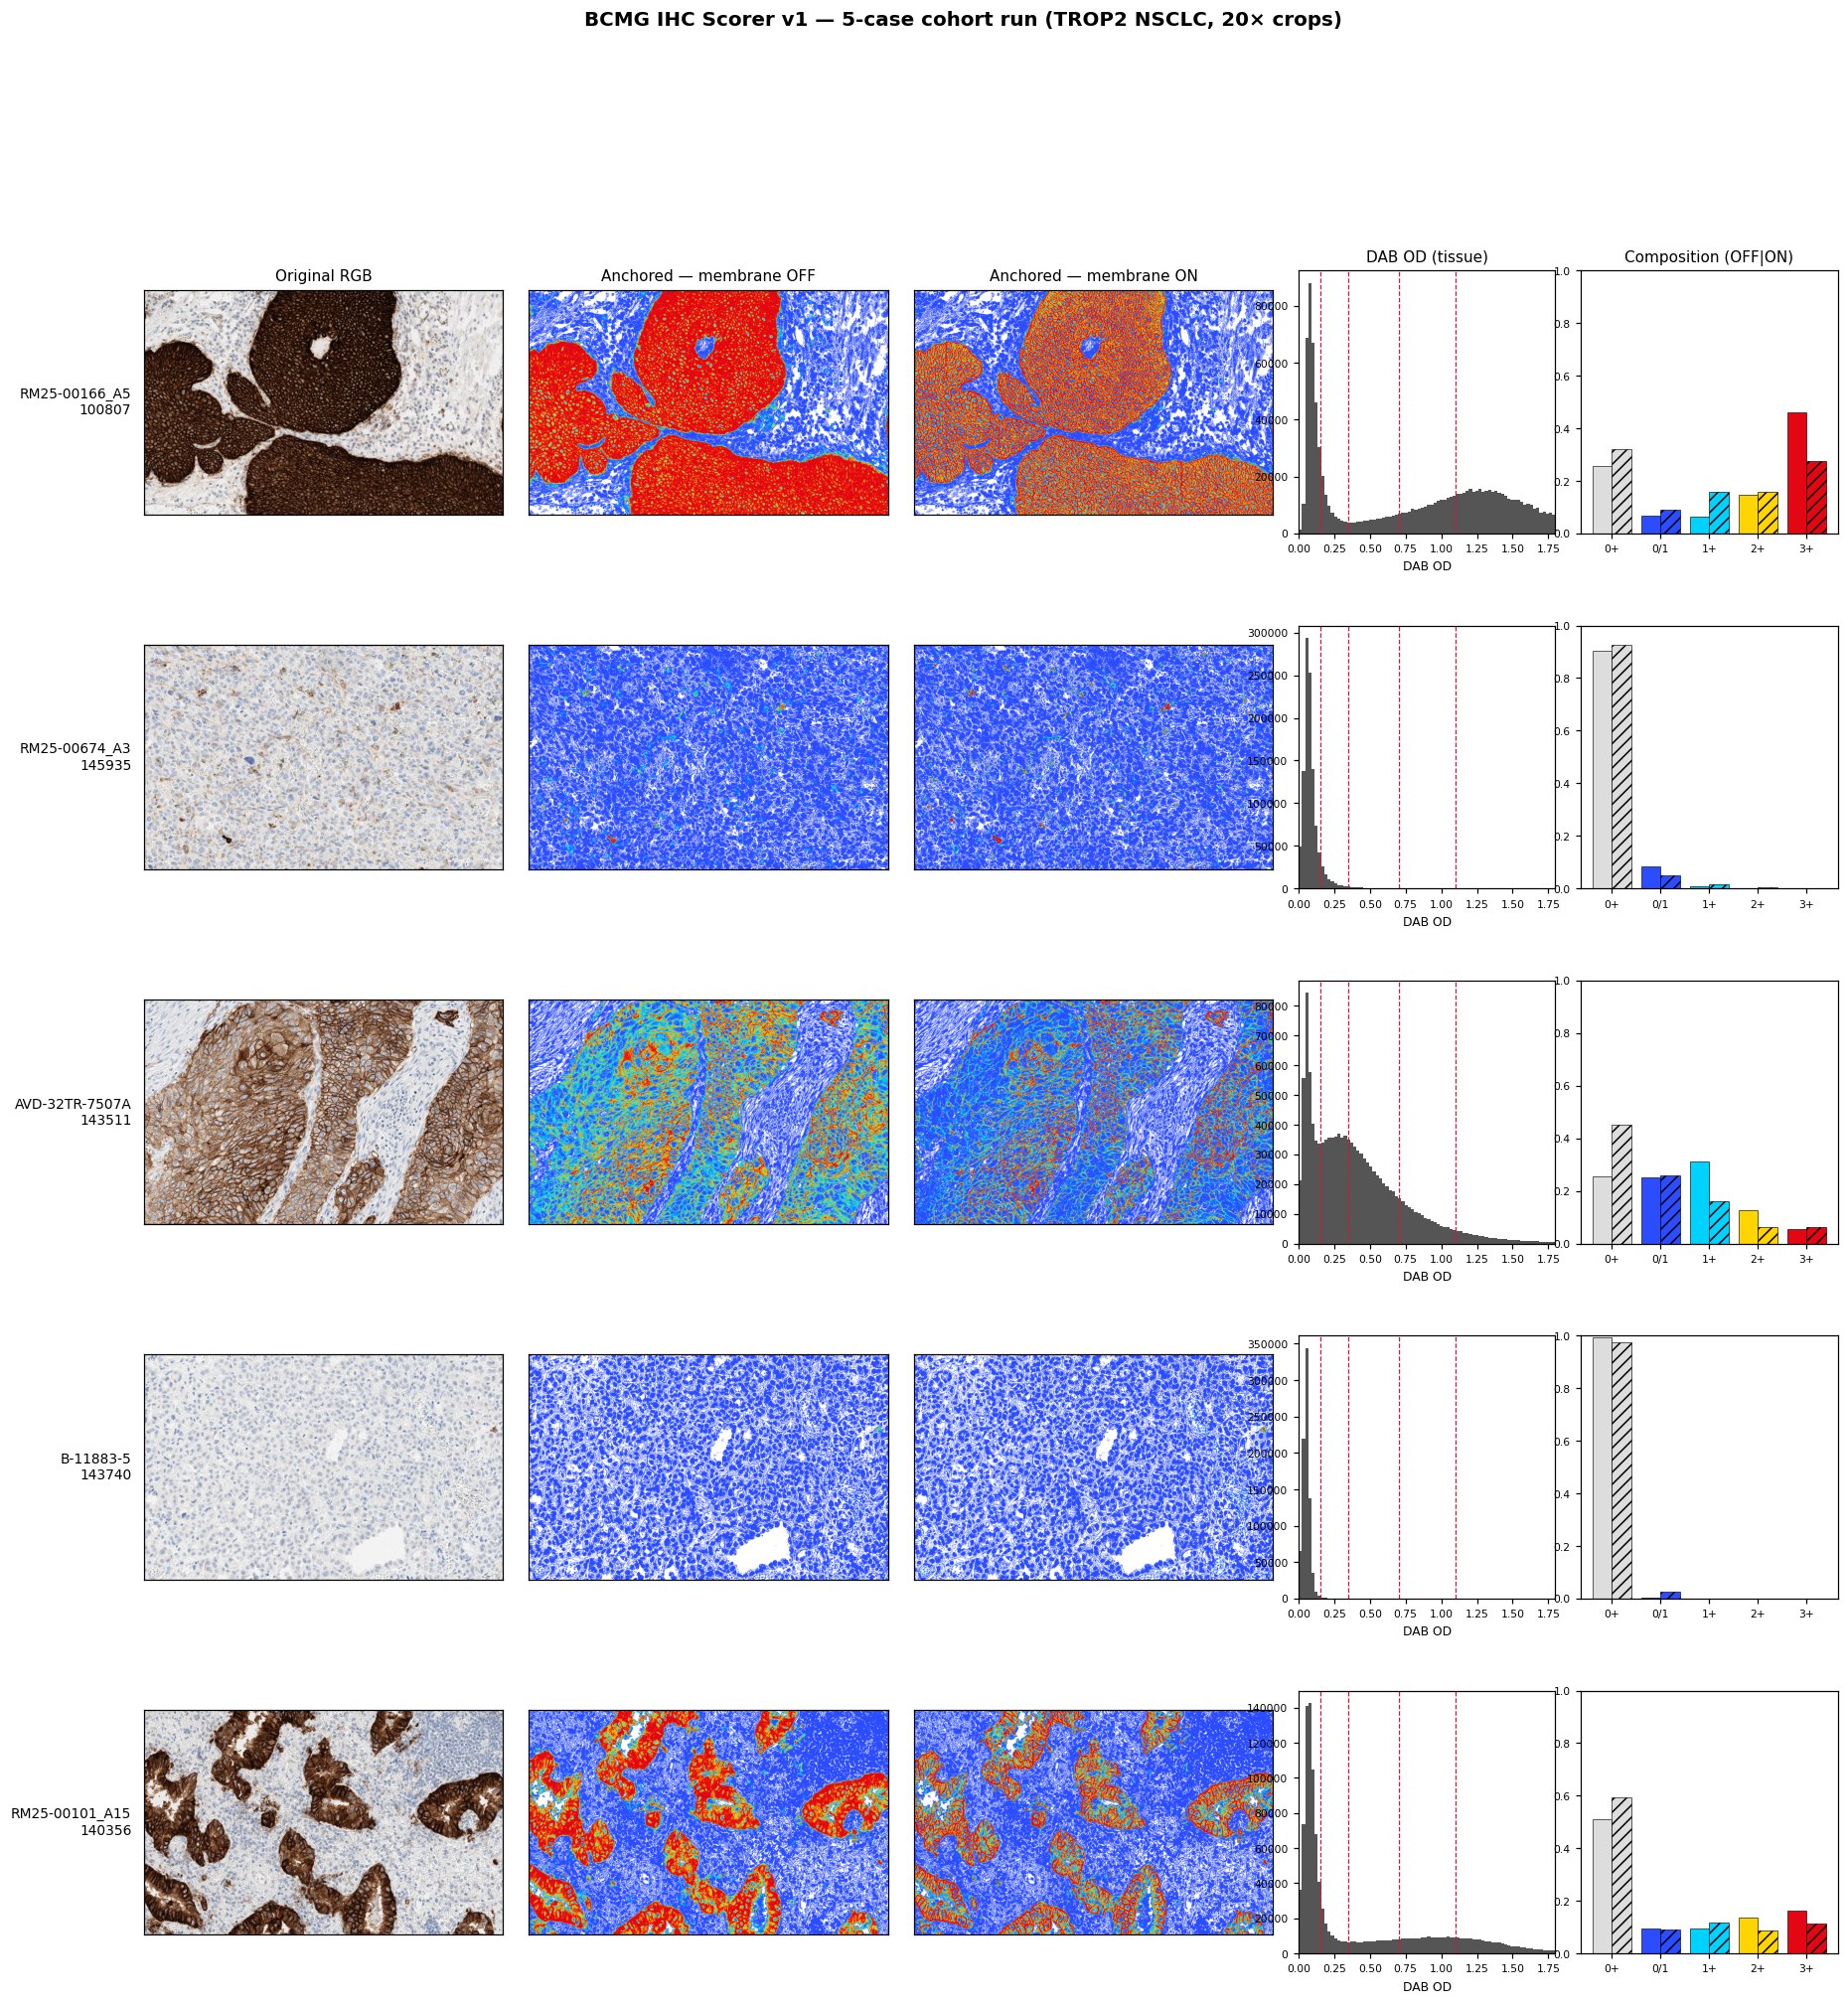
| Case | Crop | 0+ | 0/1 | 1+ | 2+ | 3+ | P99 OD |
|---|---|---|---|---|---|---|---|
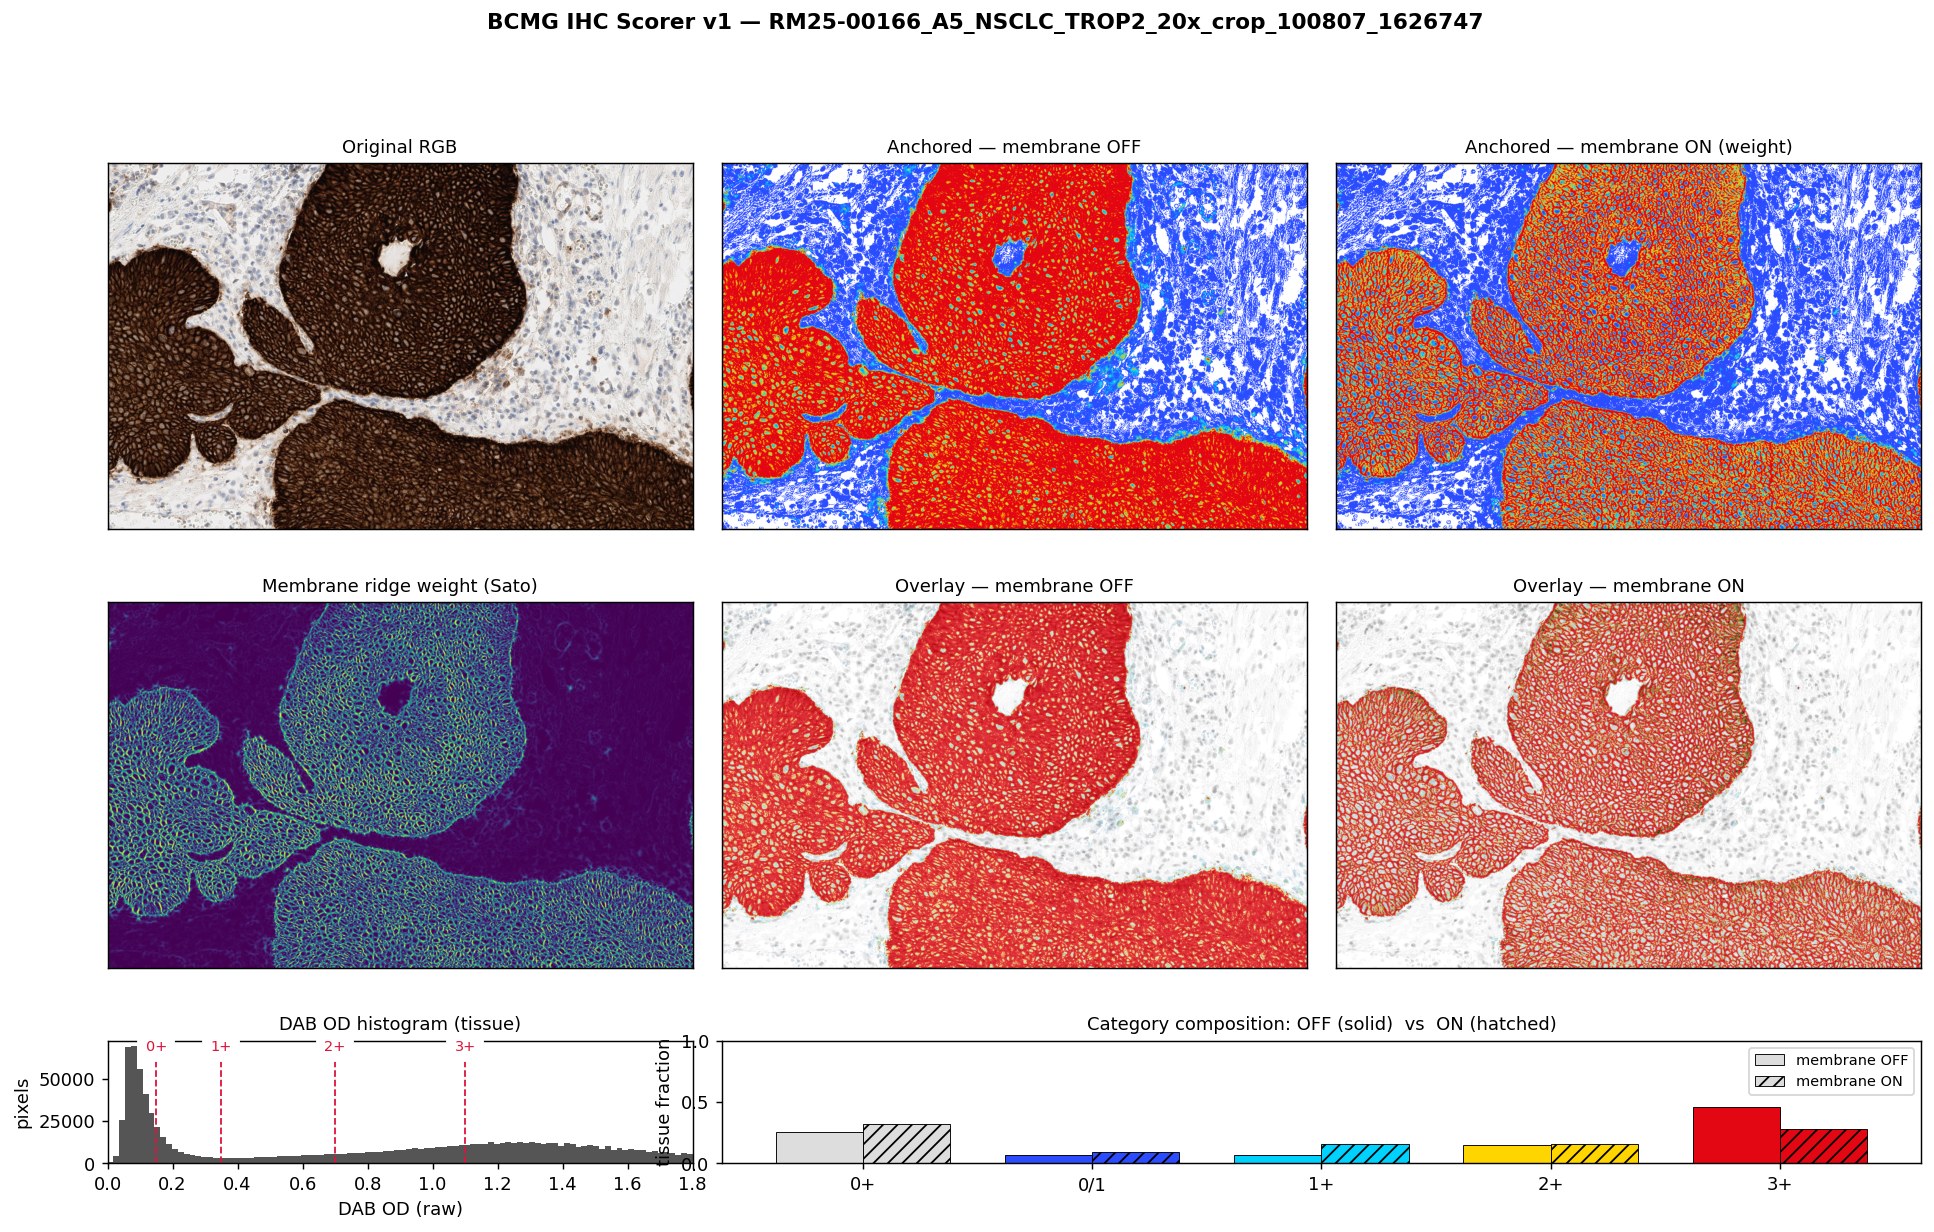
| RM25-00166_A5 | 100807 | 25.6% | 6.9% | 6.6% | 14.8% | 46.2% | 3.10 |
| RM25-00101_A15 | 140356 | 51.1% | 9.4% | 9.5% | 13.6% | 16.3% | 2.18 |
| AVD-32TR-7507A | 143511 | 25.4% | 25.3% | 31.1% | 12.7% | 5.5% | 1.85 |
| RM25-00674_A3 | 145935 | 90.4% | 8.4% | 1.0% | 0.2% | 0.1% | 0.37 |
| B-11883-5 | 143740 | 99.5% | 0.5% | 0.0% | 0.0% | 0.0% | 0.13 |
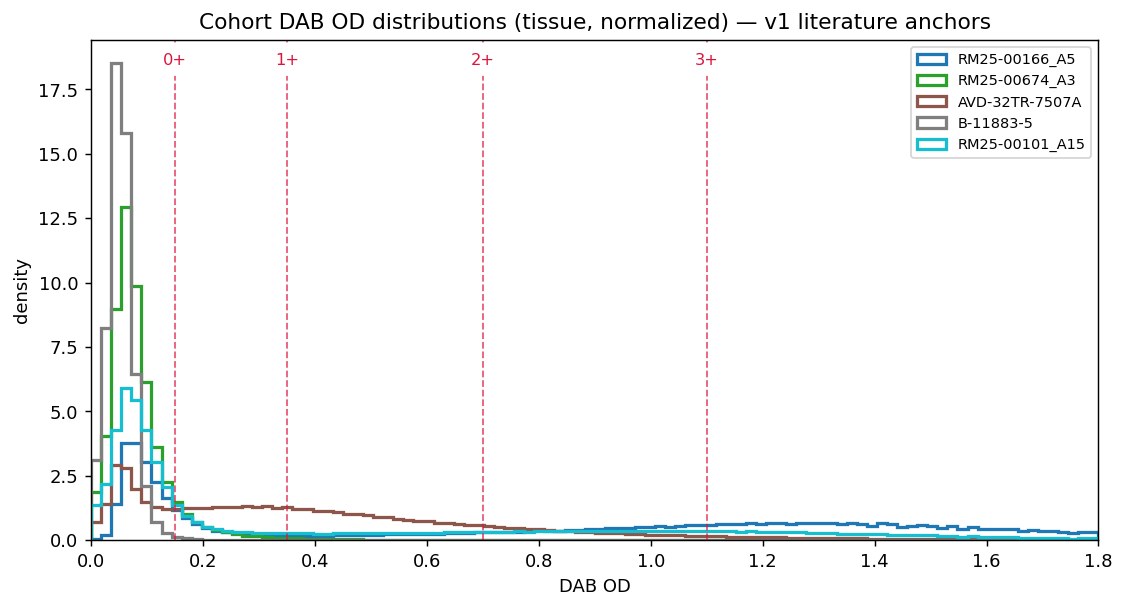
Cohort-level OD behavior.
Per-case DAB OD distributions span over an order of magnitude in both location and spread. The literature 3+ anchor at OD 1.10 is conservative relative to the cohort median P99 of 1.85, but two cases sit substantially below the 0+ anchor across the entire tissue area. This range — from sub-noise null to frankly saturated — is exactly what a cohort-level scoring tool needs to accommodate.
Intra-case heterogeneity.
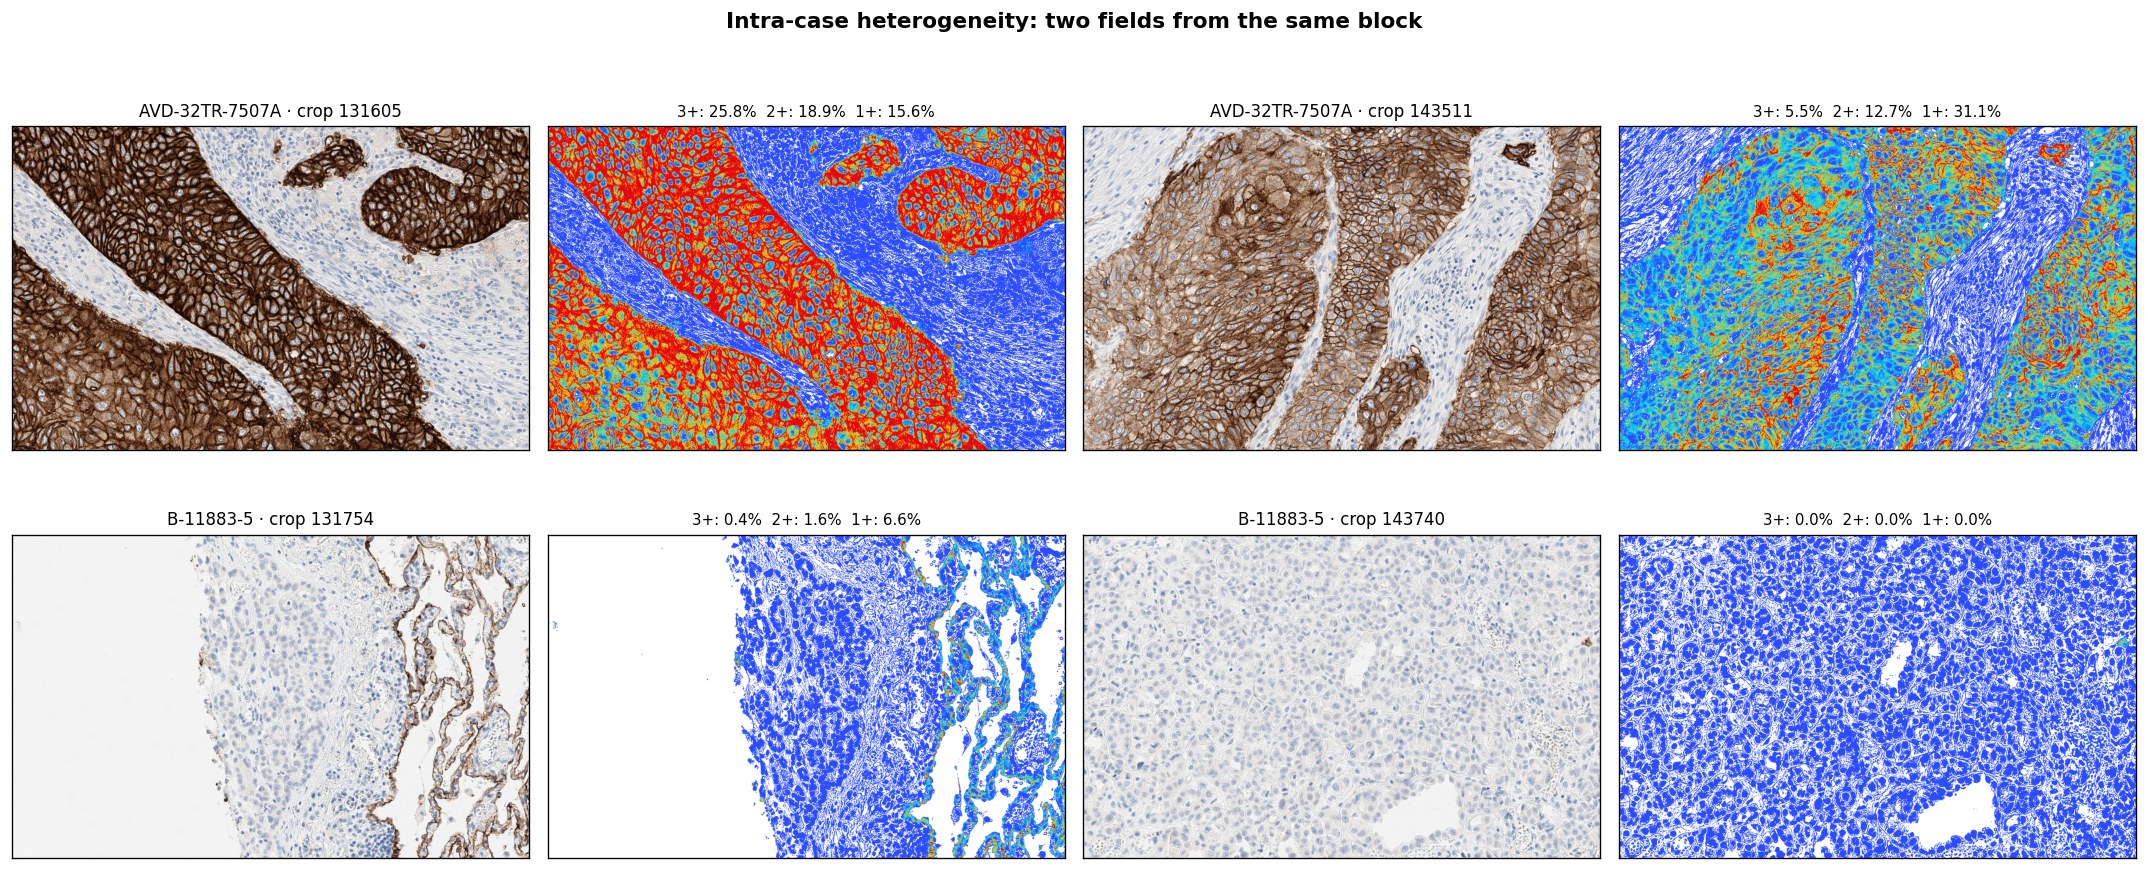
Two cases provided two non-overlapping fields each, drawn from the same paraffin block. The two fields produce strikingly different scoring profiles. AVD-32TR-7507A drops from 25.8% 3+ in one field to 5.5% 3+ in another; B-11883-5 falls from a focal 0.4% 3+ rim in one field to complete absence of supra-anchor signal in another. This is field-of-view variance, not scoring error — and it is the strongest single piece of evidence in this cohort for why per-slide anchor derivation will need to be regional, not whole-slide.
Selected case detail.
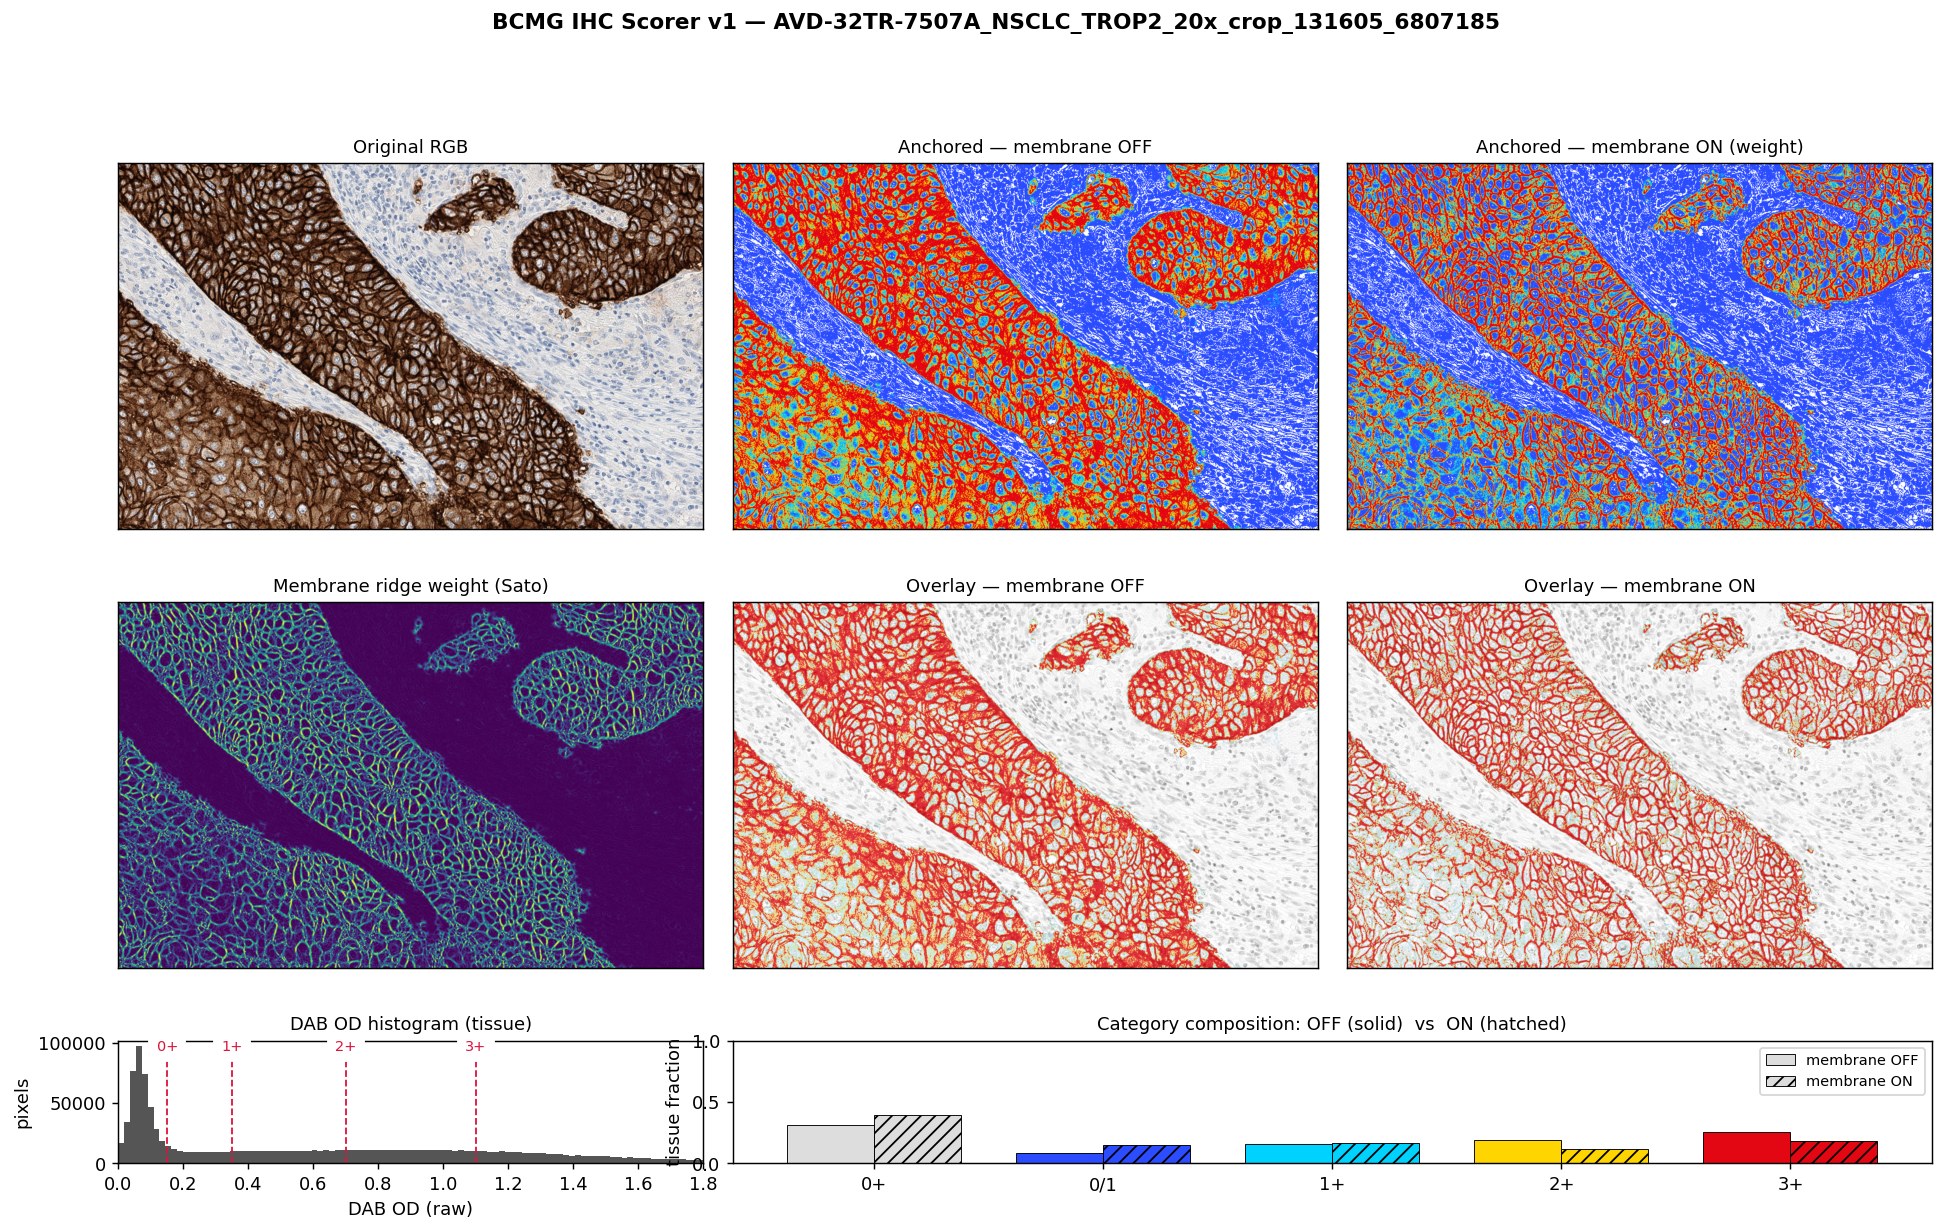
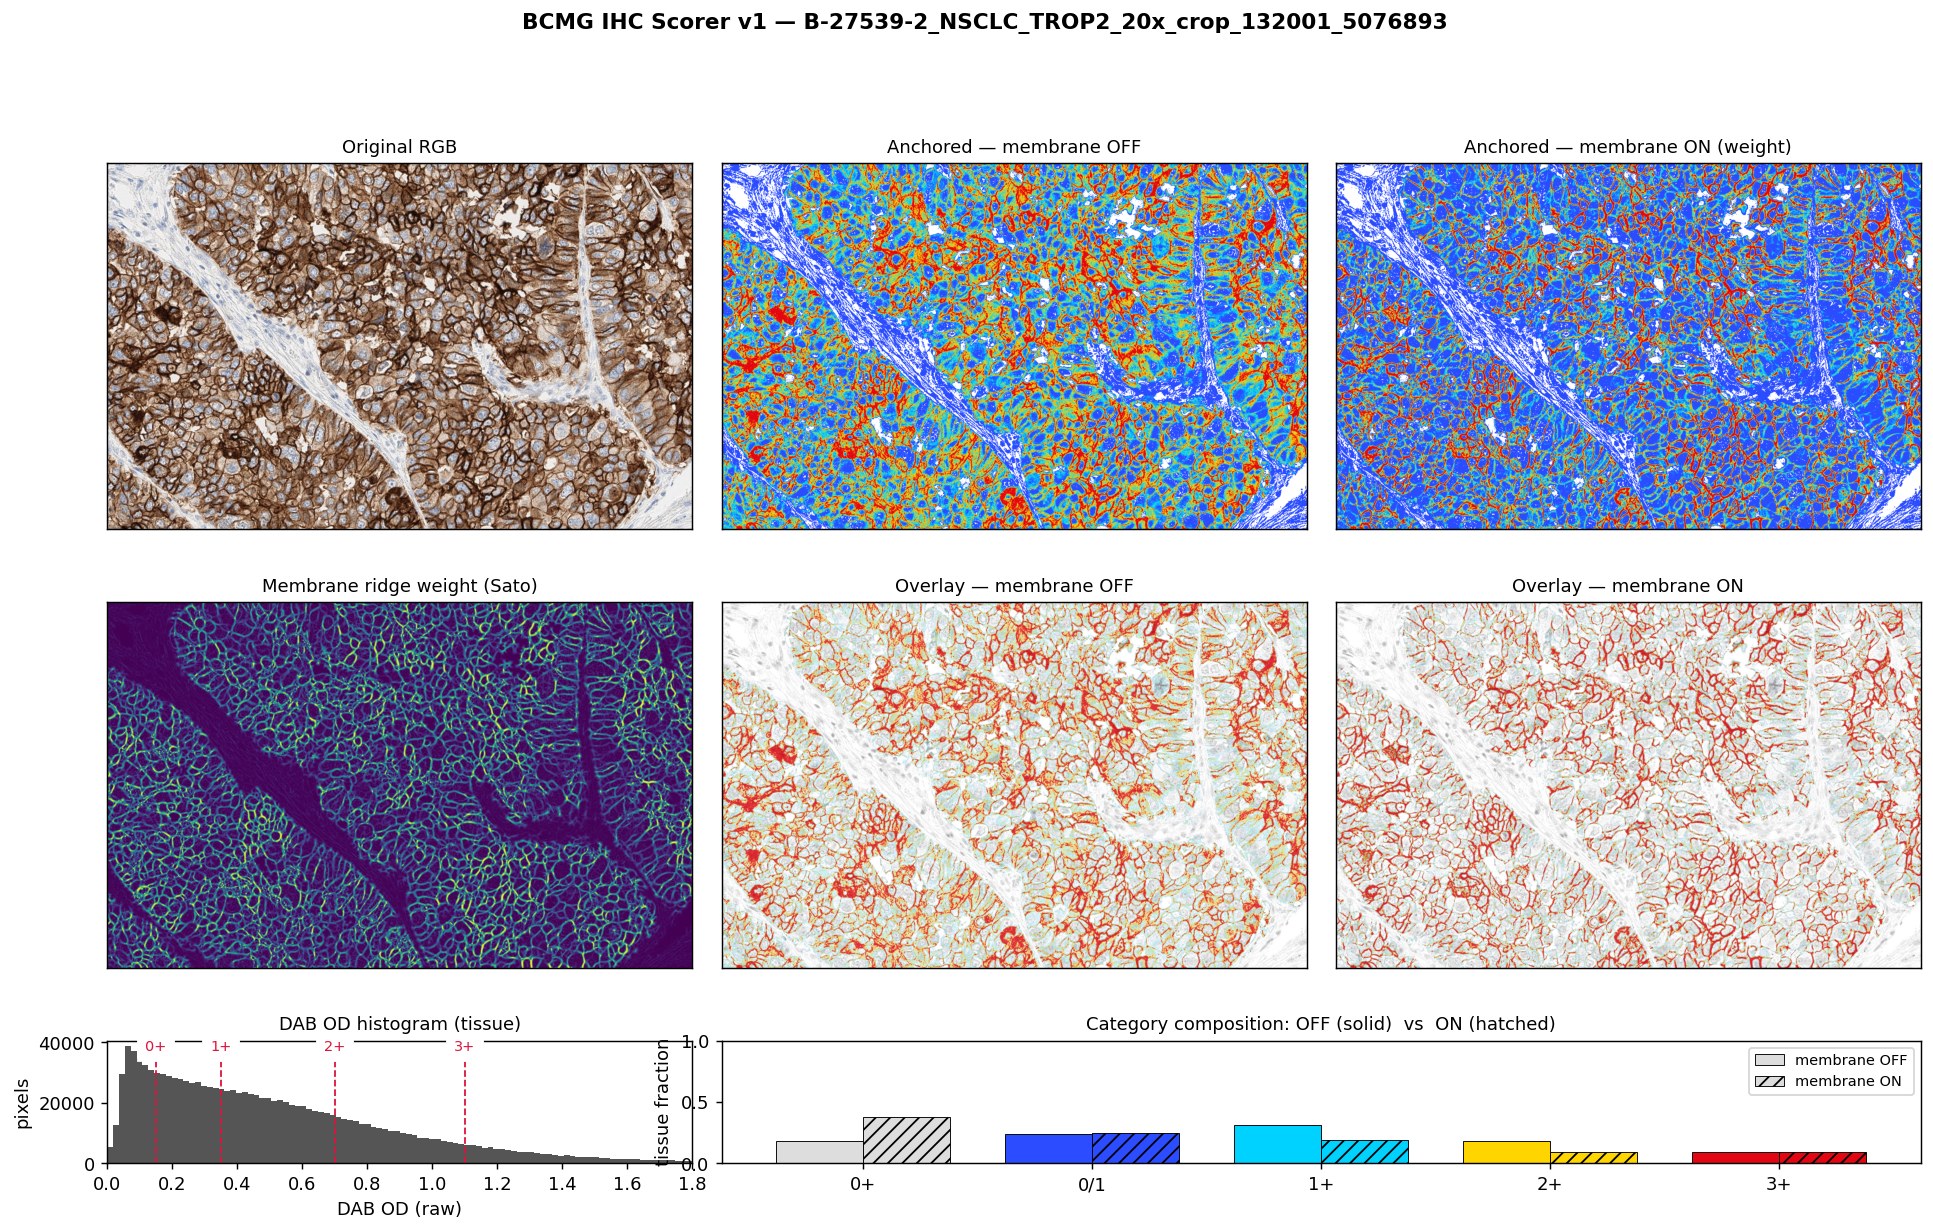
The strong-staining and moderate-staining cases below illustrate the difference the membrane toggle makes. In the strong case (AVD-32TR-7507A) the membrane filter trims diffuse 3+ signal and yields a sparser, membrane-emphasized scoring map. In the moderate case (B-27539-2) the membrane filter halves the 2+ fraction by de-emphasizing diffuse cytoplasmic signal while leaving the membrane network largely intact.
What v1 demonstrates, and what it leaves open.
v1 establishes that a fixed-anchor colormap is sufficient to recover pathologist-meaningful scoring categories across a clinically diverse cohort, without per-slide tuning. The anchored render reads in the vocabulary of the microscope: a red region is at or above 3+, a yellow region is between 1+ and 2+, regardless of which slide it came from. Cross-slide comparability is preserved by construction.
Anchored stops outperform continuous jet for clinical reading.
The 4-stop colormap maps directly onto pathologist vocabulary; continuous jet is useful when matching ViT attention visualizations but adds little for IHC interpretation alone.
Membrane vs cytoplasmic emphasis answers different questions.
On B-27539-2, the membrane filter halves the 2+ fraction. This is not noise reduction — it is a different scoring philosophy. The right answer depends on the assay.
Intra-case heterogeneity dominates the variance.
Two fields from the same block can disagree by 5× on the 3+ fraction. Per-slide anchor derivation will need to operate on tumor-selected regions, not whole-tissue percentiles.
DAB saturation is a real ceiling.
RM25-00166_A5 reaches P99 OD ≈ 3.1, well into the saturated regime. Clip-at-3+ behavior is correct for categorical scoring; any continuous H-score extension will need a sigmoidal stretch above 2+.
Limitations.
v1 uses fixed Ruifrok stain vectors; per-slide stain unmixing is deferred. The tissue mask is a coarse total-OD threshold rather than a trained foreground segmenter. Negative-control subtraction is architecturally supported but not yet exercised on paired data. The five-case cohort is sufficient for v1 validation but small for generalizability claims. No nuclear-compartment or per-cell aggregation is performed.
The pathologist as final authority.
A design principle worth stating explicitly: every automated calibration in this pipeline — anchor derivation, future stain-vector estimation, membrane emphasis — is a proposal that the pathologist can accept, reject, or A/B against the defaults. Nothing is destructive. The QC record makes this auditable. We expect to generalize this principle across the broader BCMG AI toolset.
Toward v2.
A TMA with paired hematoxylin-and-eosin, IHC, and negative-control slides from the same paraffin run is the appropriate dataset to close the open empirical questions and generalize the framework. The negative control supplies an empirical noise floor for the 0+ anchor; the IHC slide with pathologist-scored cores supplies the 3+ anchor; cohort-level aggregation of these per-slide derivations addresses stainer run-to-run variability.
Specific v2 work items include: per-core TMA dearray and reporting, regional rather than whole-tissue percentile derivation of the IHC 3+ anchor, registered negative-control subtraction, Macenko or Vahadane stain-vector refinement, a trained foreground tissue mask, optional per-nucleus aggregation, and a QC sidecar JSON schema for every scored slide. Extension beyond TROP2 to other membranous markers (HER2, CDX2, E-cadherin) and to non-membranous targets (Ki67, p53) is anticipated to require only assay-specific anchor defaults; the rendering and architecture remain unchanged.
Beyond v2, the anchored-colormap framework forms the substrate for our virtual IHC staining work, in which generated DAB images can be scored in exactly the same vocabulary as the ground-truth IHC they are being compared against. This makes the IHC Scorer a shared reference frame rather than a one-off tool — an architectural decision that becomes more valuable as the BCMG AI portfolio grows.